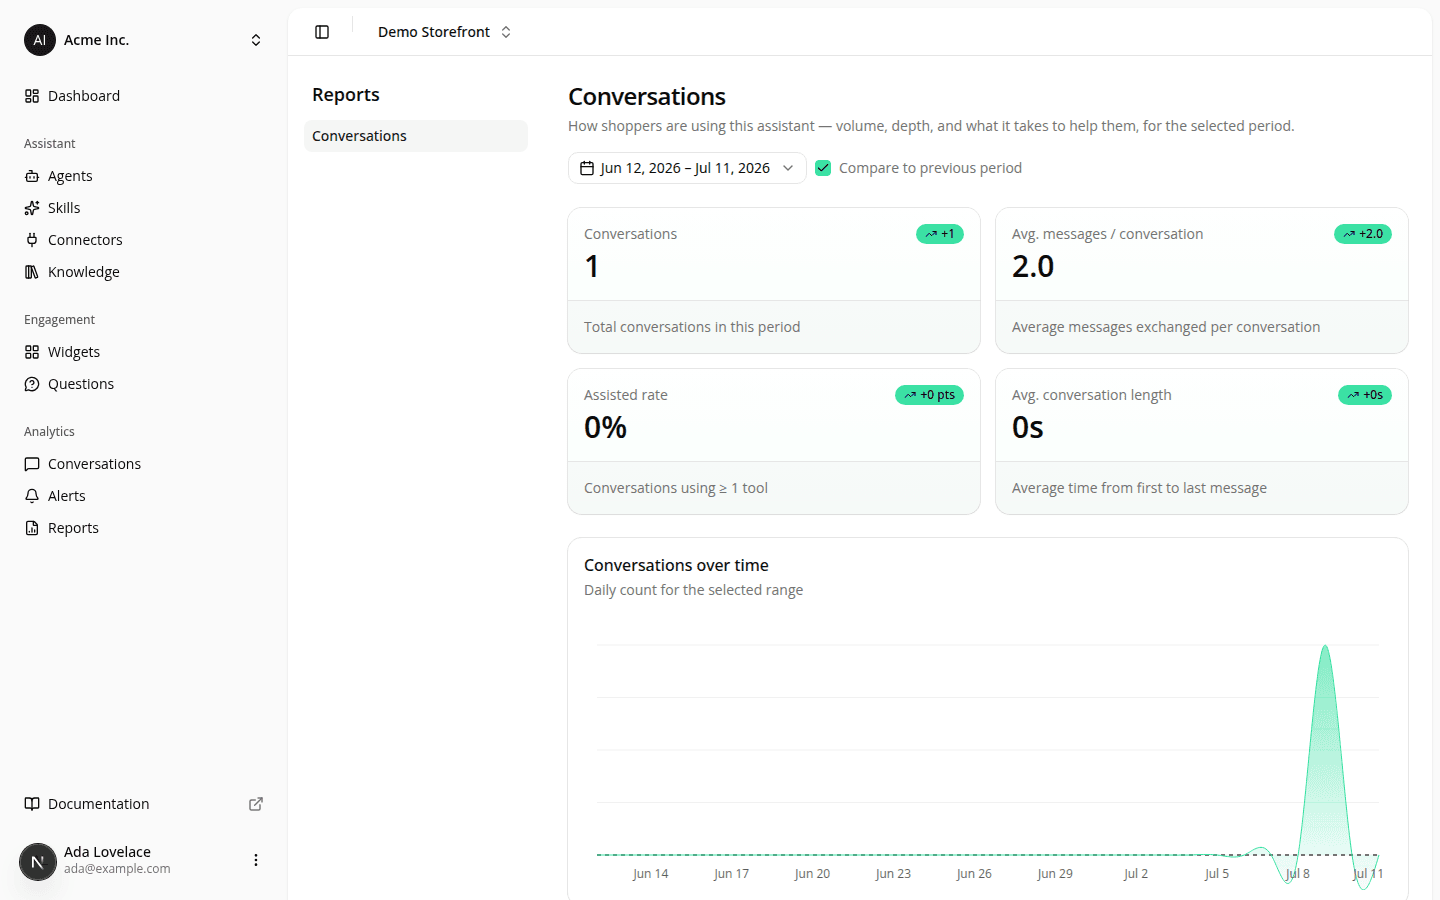
Conversations report
AddedEvery site now has a Reports section (in the sidebar, previously unlinked), starting with the Conversations report. Pick a date range and see conversation volume over time, average messages per conversation, assisted rate (conversations where the assistant used a tool), average conversation length, which tools got used, conversation counts per agent, and when conversations tend to start during the day.
Every KPI and the volume chart can be compared against the immediately preceding period of equal length (off by default, with a Compare to previous period checkbox to turn it on). Each KPI's trend badge is highlighted in your brand color when the metric is trending up, and stays neutral otherwise: a falling number isn't automatically bad news. The date range is picked from presets (Today, Last 7/30/90 days, This month, Last month) or directly on the calendar for a custom range, and it's remembered on your browser for next time.
The tool-usage and per-agent charts now show each bar's exact count right on the bar, not only on hover.
The report only counts real shopper conversations on your public site: conversations started from the Playground while testing don't count toward it.
Resources